Once you’ve built a prototype, the next step is creating a minimal viable product (MVP). The goal? To learn as much as possible about your customers and target audience while using as few resources as possible. An MVP lets you test your solution under real conditions. Adding early impact indicators at this stage can also help you track short- and mid-term changes in your target group. A quick reminder: both MVP development and impact measurement are ongoing processes. To maximize your impact, you should continuously refine both based on what you learn.
This section is for you if …
- you’re starting – or already working with your team on – an impact-driven startup.
- you can clearly define your target group, the problem you’re solving, your solution, and your intended impact.
- you’ve built and validated a working prototype.
- you’ve seen early evidence of outcomes from your solution.
- you’ve identified a market and your solution has the potential to scale.
- you’ve developed an initial business model.
Not quite there yet?
Check out the section that fits your current stage
In this section, you’ll learn how to …
- develop a minimum viable product (MVP).
- expand your impact measurement to include outcome-level changes.
Here, the focus is on the people who will benefit from your solution (target group) – so it’s all about making your product more effective and socially relevant.
We’ll cover the financial and business side of things in another section.
MVP vs. prototype: What’s the difference?
Prototypes and minimum viable products (MVPs) are both key tools in product development – but they serve very different purposes. Here’s how they compare:
- Purpose and functionality: A prototype is mainly used to visualize the design and test early ideas. It has limited features and is often the first tangible version of a new concept. An MVP, on the other hand, includes the core features needed to function and is used to test usability, design, and overall functionality.
- Field of application and development phase: Prototypes are typically tested internally or with a small group of target users. MVPs are tested among a broader market segment and represent the first version of the product that delivers real value to real users
- Purpose and maturity: Prototypes are tested internally – they’re not meant for public use. The ideas they test are still evolving and thus prone to error. MVPs, on the other hand, while minimal, are ready to go live. They’re functional and designed to be used by customers in real settings.
- Objective: Prototypes are aimed at spotting flaws and testing how a product looks or behaves across devices. MVPs are built to generate early feedback from the market and learn what it takes to grow into a full-fledged solution.
How to build your MVP and define impact indicators
Before you begin, decide which features your MVP really needs – and which can wait:
1. Priorize key features for your MVP
Start by making a list of all potential features. Then group and rank them using the MoSCoW method.
The MoSCoW method
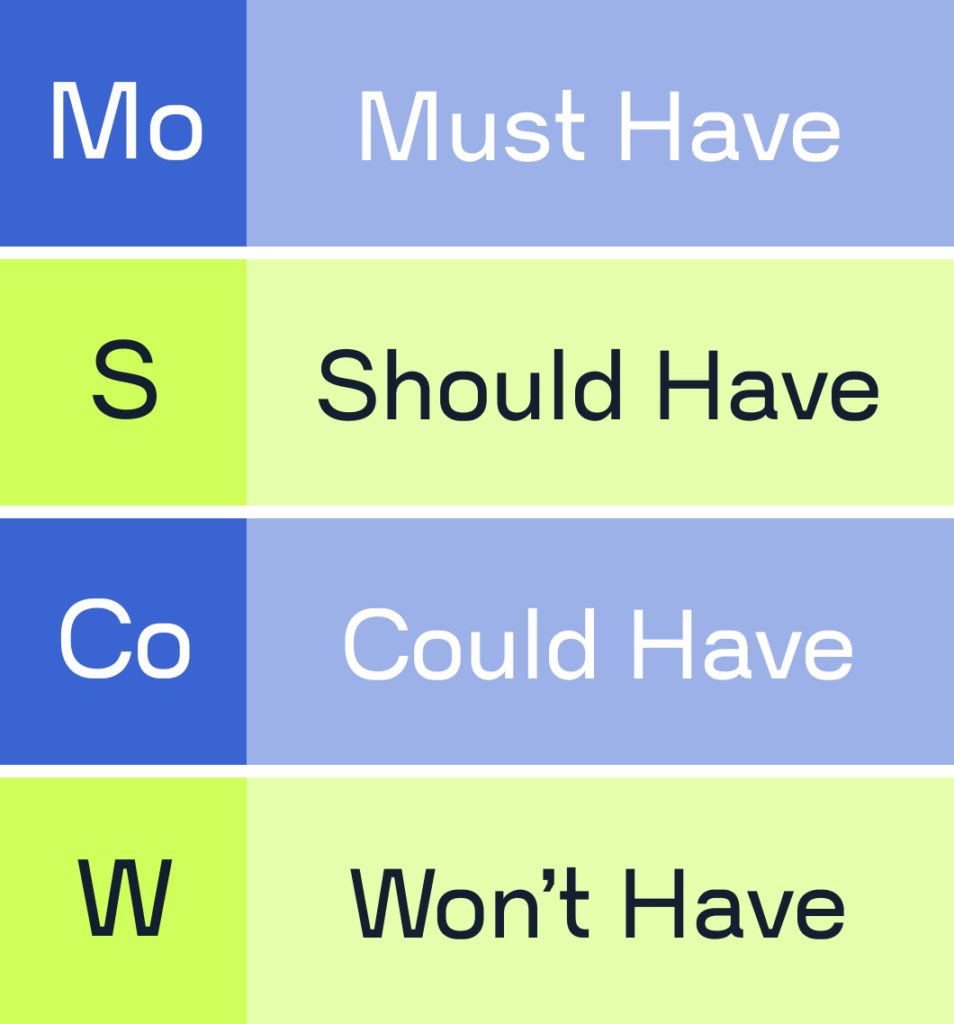
The MoSCoW method is a framework for prioritizing what matters when building your MVP. It helps you evaluate features and requirements by sorting them into four clear categories, based on how essential they are to your product’s success:
- Must have: These are the nonnegotiable features. Without them, your MVP doesn’t work or fails to meet your users’ core needs.
- Should have: These features add value, but they aren’t immediately critical. Include them if time and resources allow.
- Could have: Nice-to-haves. They aren’t essential and can be added later if time and resources allow.
- Won’t have (this time): Features you’re consciously choosing to leave out of the first version..
Start by focusing only on the “must haves.” Develop the MVP with those features that will have the biggest impact on whether your solution succeeds. For more help with prioritizing, check out the empact-effort matrix in the chapter “Solution design for impact startups: A reality check for your solution ideas.”
Plan your resources for building the MVP
From day one, be clear about the resources you’ll need. A solid resource plan helps you avoid both overallocation and underuse – key to delivering a functional, valuable product without burning out your team or overstretching your budget
1. Identify the resources you need
Break your project into smaller, manageable work packages and estimate the effort required for each one. Then define what resources you’ll need to make it happen. These might include:
Personnel: Developers, designers, project managers, workshop facilitator
Technology: Tools for development, server infrastructure, software licenses
Finances: Budget for development, marketing, or outside services
2. Plan your team capacity
Assign tasks based on each team member’s availability and workload. Build in buffer time to handle unexpected issues. Clear task assignments and early identification of bottlenecks will help your team work more efficiently – and prevent burnout or long-term absences.
3. Estimate your costs
Calculate your total costs by combining personnel, tech expenses, and any outsourced services. A detailed cost breakdown helps you create a realistic budget and manage it effectively. It also comes in handy when pitching to investors – clear numbers increase your chances of securing funding.
Define indicators for your impact goals
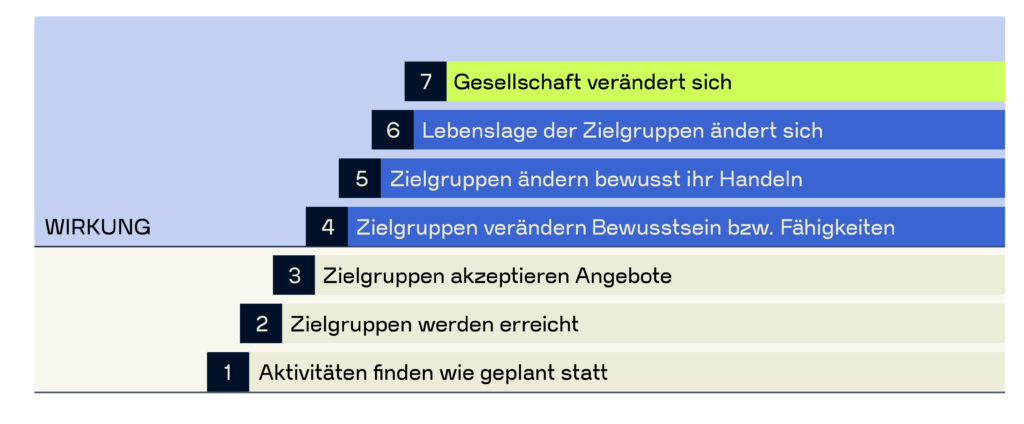
Now it’s time to choose the right metrics to measure the actual impact of your MVP – up to level 6 on the Impact Ladder.
1. Focus on outputs and outcomes
By measuring your results up to level 6 of the Impact Ladder, you can start to see whether your solution is creating meaningful improvements in people’s lives.
Why measure up to level 6 ?
Prove real change
You’re not just tracking shifts in awareness or behavior (levels 4 and 5) – you’re capturing actual improvements in the living conditions of your target group (level 6)
Start measuring impact early
Even if your MVP does not yet have the full impact of a mature product, measuring up to level 6 can give you early signals of its potential for broader social impact (level 7).
Validate your concept
You’ll have a better sense of whether your MVP has the potential to drive lasting change over time..
Spot challenges early on
Metrics at level 6 can help you identify obstacles before they grow into bigger issues.
Make better decisions
Data at this level gives you a stronger foundation for deciding how to develop or adjust your MVP going forward.
Build stronger arguments for stakeholders
Clear evidence of real-life improvements (level 6) is compelling for investors, funders, and partners who want to see impact backed by results.
Example indicators for measuring impact up to level 6 of the Impact Ladder:
Step 1 — Activities take place as planned
- Number of workshops/trainings/events delivered
- Percentage of project activities implemented as planned
- Number of staff/volunteers involved
- Quantity of materials distributed (e.g., flyers, textbooks)
- Timely delivery of project milestones
- Number of products developed or manufactured
- Number of trees planted in a reforestation project
Step 2 — Target groups are reached
- Number of applications/registrations for a program
- Reach across various communication channels (e.g., social media followers, newsletter subscribers)
- Number of customers aware of the product
- Area of renaturalized land (in hectares)
Step 3 — Target groups accept the offering
- Participation rates in events/programs
- Completion rates for courses/programs
- Purchase or usage rates of your products or services
- Participant satisfaction rates
- Repeat participation, purchases, or product usage
- Tree survival rate after six months in reforestation efforts
Step 4 — Target groups gain awareness or skills
- Number of participants who have gained new knowledge on a specific topic
- Shifts in attitudeswithin the target group
- Number of participants demonstrating new skills after a workshop or training
- Increased motivation to change behavior, triggered by internal or external incentives
- Increase in number of opportunities for participants to apply their new skills
- Number of customers who can accurately describe the product’s features after purchase
- Increase in biodiversity in renaturalized areas
Step 5 — Target group changes behavior
- Number of people who adopt new behaviors as a result of participation, use or purchase (e.g., more sustainable consumption habits)
- Number of participants actively involved in new initiatives or projects
- Number of new collaborations or partnerships formed as a result of the initiative
- Return of endangered species to the ecosystem
Step 6 — Target group’s living conditions improve
- Percentage of the target group with improved social or economic conditions (e.g., access to better jobs or education)
- Number of individuals whose income or financial stability increased through participation or product use
- Improvements in health or well-being of the target group
- Higher customer satisfaction related to the core problem your solution addresses
- Measurable improvement in air quality (e.g., lower levels of particulate matter or NO₂ in urban areas)
- Increased carbon capture from reforested areas
2. Set clear goals
Define clear, measurable, realistic, and time-bound goals for your impact indicators by using the SMART framework:
- Specific: Focused and clearly defined
- Measurable: Quantifiable
- Achievable: Realistic given your current resources
- Relevant: Aligned with your broader objectives
- Time-bound: Set within a clear timeframe (two to four months)
3. Establish a baseline
Your baseline is the starting point for measuring change. It helps you compare the situation before and after your intervention – like the number of people who understand healthy eating or have basic stress resilience skills.
Whenever possible, base your baseline on official statistics, not self-reported figures. Relying on self-assessment increases the risk of overstating your impact (also known as impact washing).
4. Set up a measurement system and data collection plan
By defining your objectives, indicators, data sources and responsibilities, you create a solid foundation for your MVP and ensure that all important aspects are taken into account. A simple Excel spreadsheet can serve as your data collection plan. It should include the following columns:
Goal
Indicator
Base value (baseline)
Target value
Data source (e.g., internal records, surveys, observations or external sources)
Survey method (e.g., questionnaires, interviews, observations or document analyses)
When/how often is it collected?
Who collects the data?
Who analyzes the data?
5. Share your impact data in a clear and compelling way (e.g., through an impact dashboard)
An impact dashboard gives you a quick, easy-to-read overview of your most important KPIs – no need to dig through long reports. It helps you spot trends early, make faster data-driven decisions, and boost transparency with your stakeholders.
You can build your dashboard in something simple like an Excel spreadsheet or use specialized tools – it all depends on your needs and resources.
Next chapter: Reality check
You’re now well-positioned to develop an MVP that not only works but creates real impact.
Once your MVP is ready, we recommend conducting a reality check. In the next chapter, you’ll learn how to collect reliable data on how well your solution is received, how effective it is, and whether it has the potential to scale.